
ACP Home | Organic Chemistry I | Organic Chemistry II | Lecture | Laboratory | General Chemistry | Laboratory Syllabus
Separation & Purification of
Components of an Analgesic Tablet
Experiment Description & Background
ACP Home | Organic Chemistry I | Organic Chemistry II | Lecture | Laboratory | General Chemistry | Laboratory Syllabus
Separation & Purification of
Components of an Analgesic Tablet
Experiment Description & Background
|
|
|
|
(of conjugate acid) |
|
| Carboxylic acids | 4-6 | Amines | 10-13 | |
| Phenols | 8-10 | Imines | 10-13 | |
| Secondary imides | 14-16 | |||
| Sulfonamides | 7-10 |
Table 1: Some Ionizable Organic Functional Groups
 |
 |
Figure 1: Ionization Schemes for a Phenol (acid) and an Amine (base)
The three components of the
analgesic
tablet that are separated in this experiment each have ionizable
functional
groups. Aspirin contains an acidic carboxylic acid, acetaminophen
contains an acidic phenol, and caffeine contains a basic amine.
Ionization
schemes for these more complex structures are illustrated in Figure
2.
Note that the acid (or conjugate acid) is always on the left, and the
base
(or conjugate base) is on the right for each ionizable functional group.
 |
 |
 |
Figure 2: Ionization
Schemes for Aspirin, Acetaminophen and Caffeine
|
|
|
Figure 3: Hendersohn-Hasselbach Equation |
Ionized forms of organic acids and ionized forms of organic bases are generally soluble in aqueous environments (i.e., ionized forms are very polar and soluble in very polar solvents like water). Organic acids and bases can be ionized in aqueous environments of the appropriate pH. The Hendersohn-Hasselbach equation, given in Figure 3, relates the pKa of an ionizable functional group, the pH of its environment, and the ratio of ionized to unionized forms of the functional group. The Hendersohn-Hasselbach equation can be used to calculate exactly how much of a particular acid or base is ionized (relative to the total amount present) in an aqueous solution of a specific pH. |
 . . Figure 4: Structure of isoproterenol, a bronchodilator |
The ionizable functional groups of the molecule must be
identified
and the pKa values for each of the ionizable functional groups must be
found.
The pH of the environment must be determined (i.e., What is the pH of a 0.05M solution of NaOH?) The ionization schemes for each ionizable functional groups must be drawn. |
The drug in Figure 4 contains a phenol, a secondary alcohol, and a tertiary amine. Only the phenol and tertiary amine are ionizable functional groups. The pKa values for each of these functional groups were found in the appendix of "The Textbook of Organic, Medicinal and Pharmaceutical Chemistry, 10th edition".
The pH of a 0.05M solution of NaOH can be calculated. NaOH is
a strong base, meaning it is essentially 100% ionized. The
molarity
of a solution of NaOH is the same as the molarity of HO- ions.
Thus,
for a 0.05M solution of NaOH, the concentration of HO- ions is
0.05M.
Two equations are used to calculate the pH of this solution. The
first is to determine the pOH, then using the pOH, determine the pH.
|
pOH = -log [HO-] |
The pH can be determined from the pOH using the equation:
pH + pOH = 14 |
The ionization schemes for each of the two ionizable functional
groups
are shown in Figure 5. Notice that
for the acid (phenol), the
unionized form is on the left and the ionized form is on the right, but
for the amine, the ionized form is on the left and the unionized form
is
on the right.
 |
Figure 5: Ionization Schemes for Ionizable Functional Groups of a Drug Molecule |
|
|
| Now the Hendersohn-Hasselbach equation can be used to
determine how
much of each of these ionizable functional groups are ionized in a
solution
of 0.05M NaOH. The equation must be applied to each functional
group
individually. These calculations predict that the major form of
the
drug at a pH = 12.7 would look like the structure depicted in Figure 6.
Figure 6: Major form of the drug at pH = 12.7 |
pH = pKa + log base/acid For acidic functional groups, since the conjugate base is
ionized and
the acid is unionized, the equation could also be written: 12.7 = 9.9 + log I/U So the ratio of ionized (I) to the unionized (U) form of the phenol is 631. This means there is much more of the ionized form of this functional group present in an environment where the pH = 12.7. |
pH = pKa + log base/acid For basic functional groups, since the base is unionized
and the
conjugate acid is ionized, the equation could also be written: 12.7 = 8.7 + log U/I So the ratio of unionized (U) to the ionized (I) form of the phenol is 10,000. This means there is much more of the unionized form of this functional group present in an environment where the pH = 12.7. |
It is common that the amount of the ionized form of a functional
group
is expressed as a percentage. The percent ionization of a functional
group
at a given pH can also be calculated using two equations.
|
From the Hendersohn-Hasselbach equation for the phenol, we know that 631 = I/U We also know that the sum of the ionized and unionized forms of the functional group must equal 100% or: 100% = I + U If 631U is substituted into this equation for I (from equation above): 100% = 631U + U |
From the Hendersohn-Hasselbach equation for the amine, we know that 10,000 = U/I We also know that the sum of the ionized and unionized forms of the functional group must equal 100% or: 100% = I + U If 10,000I is substituted into this equation for U (from equation above): 100% = I + 10,000I |
|
|
| Ionization and Solubility Solubility of an organic molecule in a particular solvent is dependent on how closely the polarity of the molecule "matches' the polarity of the solvent. Molecules with polarities very similar to the solvent will tend to be very soluble. Polar molecules tend to be soluble in polar solvents, while non-polar molecules tend to be soluble in non-polar solvents. This is the basis of the simple rule "like dissolves like" |
Polar molecules are soluble in polar solvents. Non-polar molecules are soluble in non-polar solvents. |
An acid or base extraction can be used to separate a molecule with ionizable functional groups from contaminants or other compounds. For example, a base extraction could be used to separate the product of the reaction shown in Figure 8 from unreacted starting material. The product contains an ionizable functional group (carboxylic acid) and the starting material does not. Under the experimental conditions used, the reaction only yields 65% of the product, leaving ~35% of the starting material intact. After the reaction is over, the product must be separated away from the unreacted starting material.
To use base extraction for separation of the product from the staring material, the reaction mixture, containing both the alcohol and the carboxylic acid, are dissolved in methylene chloride, a medium polarity solvent that is not water soluble. The solution is added to the separatory funnel (with the stopcock closed). An equal volume of aqueous base (at a pH sufficient to ionize the carboxylic acid) such as 0.05M NaOH is added to the separatory funnel. Two distinct layers form in the funnel since the two solvents are not soluble in each other. (Their polarities are too different). The two layers are then "mixed" by shaking the funnel allowing the reaction mixture to be partitioned between the two solvents (Figure 9). Shaking the separatory funnel in this manner brings the basic aqueous layer into contact with the carboxylic acid, causing it to ionize and become more polar. After the partitioning, each component of the mixture will end up dissolved in the solvent it is most soluble in. The medium polarity alcohol will remain dissolved in the methylene chloride, while the ionized carboxylic acid product will move to the more polar basic aqueous layer. The two layers separate out again after the funnel is returned to the ring stand and allowed to sit undisturbed. The bottom layer can be drained out into a clean beaker by opening the stopcock and closing it again just at the boundary between the to layers. A second beaker can then be used to collect the top layer in a similar manner.
 Figure 8: Oxidation of an alcohol to a carboxylic acid |
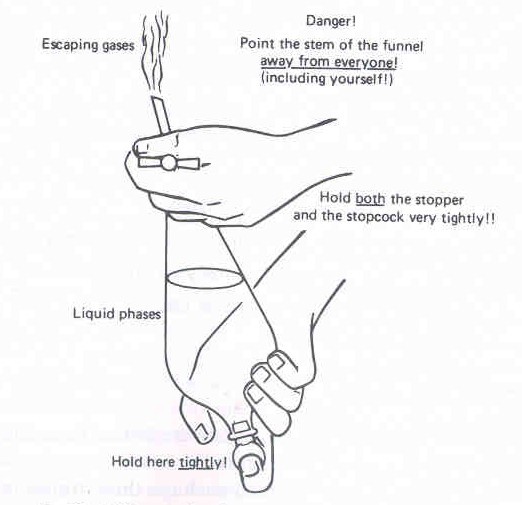 Figure 9: Shaking the separatory funnel (adapted from Zubrick, p. 161) |
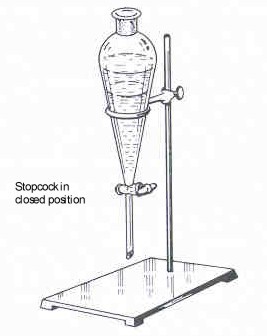 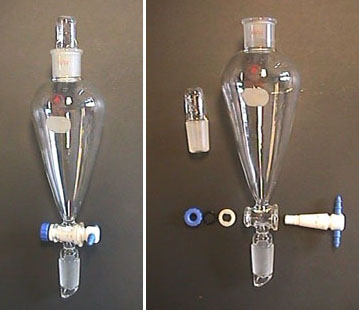
Figure 7: Separatory Funnel |
Shaking the separatory funnel allows the two solvents to mix and
provides
the opportunity for components dissolved in one of the solvents to be
transferred
to the other solvent. Proper technique for shaking the separatory
funnel is illustrated in Figure 9. The stopper should be placed
in the top of the funnel before removing it from the ring and the
stopcock
should be in the closed position. The stopper must be held firmly in
place
by holding it with the index finger or palm of the hand. The stem
(out spout) must be directed into the back of the hood and the funnel
should
be positioned with the stem pointed upward at an angle of ~
45degrees.
Mixing occurs by gently shaking the funnel for ~10-30 seconds, after
which
the stopcock should be opened, with the funnel tilted upward, to
vent any gases generated by the shaking process. After venting
the
gases, the stopcock should be closed and the funnel returned to the
ring.
The mixture in the funnel will be cloudy when the two immiscible
solvents
mix during shaking. The two distinct solvent layers will separate
out after the funnel is allowed to sit undisturbed in the ring for a
few
moments. Sometimes emulsions form and the two layers do not
separate
cleanly. emulsions are mixtures of two immiscible solvents where
one solvent becomes encapsulated ("trapped") by the other
solvent.
Techniques have been developed to help break emulsions that form during
the extraction process and are summarized Table 2.. Be aware that
breaking an emulsion is often tricky and requires a bit of
finesse.
one or possibly all of the techniques listed in Table 3.2 may be
necessary
to break the emulsion.
| Addition of small quantities (10-100mg) of salt (NaCl or equivalent) to the funnel, followed by gently shaking or swirling. Adding too much salt to the separatory funnel may clog the stopcock, so add sparingly. |
| Addition of one or the other of solvents used in the extraction. |
| Addition of ethanol which has solubility in both aqueous and organic solvents. |
| Addition of small quantities of dilute aqueous acid or base (1-2ml). Note that some components may react with acid or base so use this method as a last resort if the components are acid or base sensitive. |
Table 2: Techniques for breaking emulsions
In addition to emulsions, separation of the two solvents is often complicated by a "third layer" or the interface between the two solvents. A large interface is likely just a small emulsion and can be handled using the techniques listed in table 3.2. Usually the best technique to use for an intereface problem is to add on or the other of the two solvents used in the extraction. The interface contains both solvents and likely all the components of the mixture. If the interface is collected with a specific layer, that layer will be contaminated with all components of the mixture. To ensure a completely clean separation of the two layers, it is sometimes nessary to collect the interface in a third beaker.
The two layers are separated after shaking by draining the lower layer from the bottom of the separatory funnel. The stopper must be removed from the funnel prior to draining. The bottom layer is drained into a clean, labeled beaker or flask by opening the stopcock and closing it quickly when the interface region reaches the bottom of the funnel. A second beaker or flask is used to collect the remaining layer in the funnel.
|
|
Creating a flowchart to summarize an experimental procedure requires familiarity with the experiment and all the techniques used to complete the experiment. It also requires planning ahead on how to best organize various parts of the procedure, and thoroughly working out appropriate sequencing of steps. Usually a flowchart can be built from a text-based procedure.
Computer scientists use standard symbols (and some custom symbols) for constructing flowcharts. Simple laboratory flowcharts use boxes and arrows to indicate actions (in boxes) and sequencing of actions (arrows). Flowcharts always start at the top and flow down, or begin at the left and flow right. Most flowcharts have branch points where a single action leads to two or more additional actions.
The flowchart that summarizes the procedure for "The Separation and
Purification of the Components of an Analgesic" experiment (Figure
3.10).
(Refer to the text
procedure for the experiment to help follow through the description
of the flowchart). The first step of the experiment, "grind
four Excedrin tablets" is placed in a box at the top of the page.
(View
sample flowchart). The second step of the experiment is
indicated
in the flowchart by an arrow leading from this box to a second box
stating
the next action, "mix the ground tablets in 15ml CH2Cl2
and
heat". Note that details about flask size or exactly how to warm
the solution are not included in the flowchart. The second box
leads
to a third box with the action "vacuum filter the mixture". A
branch
point results after completion of the third step of the procedure,
since
the process of filtration leads to both a solid and a solution
(filtrate)
upon which further actions must be performed. A branch point is
indicated
in the flowchart using a 'T' or "Y", with arrows leading to two
distinct
boxes. View the complete
flowchart for the of "The Separation and Purification of the
Components
of an Analgesic" experiment.
Two values must be known to calculate the percent recovery of a
specific
component in a mixture, the experimental mass (weight) of the isolated
component, and the amount of the component reported to be in the
starting
mixture. Each Excedrin tablet contains 250 mg of aspirin, 250 mg
of acetaminophen and 65 mg of caffeine. If four tablets are used
in this experiment, then the total reported amount of aspirin and
acetaminophen
is 1000 mg each, and the total amont of caffeine is 260 mg. the
equation,
given below can then be used to calculate the percent recovery for each
component.
Be sure to use the same units for the experimental value and the
reported
value, i.e., mg.
x mg of ASA isolated X 100 = % recovery
x mg of ACE isolated X 100 = % recovery
x mg of CAF isolated X 100 = % recovery