
Organic Chemistry Laboratory I
Extraction of (+) and (-)-Carvone from Oil of
Caraway and Oil of Spearmint
Experiment
Description & Background
Organic Chemistry Laboratory I
Extraction of (+) and (-)-Carvone from Oil of
Caraway and Oil of Spearmint
Experiment
Description & Background
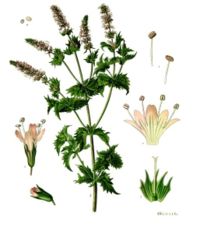 Spearmint
|
Essential
oils, derived from natural products, have been used for
centuries as flavorings, fragrances and for medicinal purposes.
These
oils typically contain multiple organic components, generally with one
or more compounds dominating the mixture to provide characteristic odor
and properties. Essential oils are typically isolated from plant
sources through distillation or extraction. Oil of spearmint is
derived from the leaves of the spearmint (Mentha spicata) plant.
A major constituent of oil of spearmint is the R enantiomer of
carvone. Minor amounts of limonene, a metabolic precursor of
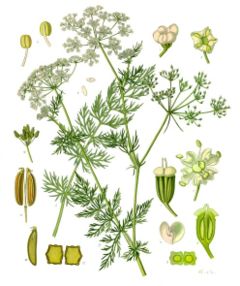
carvone is also present in oil of spearmint. Caraway oil is
extracted from caraway seeds (Carum carvi) and
contains manily the S enantiomer of carvone along with higher levels of
limonene. The limonene in oil of caraway is also a precuror to
S-carvone. Specific carvone enantiomers can be isolated in pure
form from oil of spearmint or oil of caraway using column
chromatography. Limonene, a less polar constituent of these
essential oils can be separated from the carvones during
chromatography. Purity of the isolated samples can be evaluated
by thin layer chromatography and spectroscopic analysis, and the
optical
purity of the enatiomers can be evaluated using polarimetry. |
 Caraway
|
   Analytical TLC Analysis |
Chromatography is an
experimental method that
is used in the laboratory to separate and characterize organic
compounds. Chromatography may be used preparatively or
analytically. Preparative chromatography is used to physcially
separate components of a mixture for further use and
characterization.
Thus, preparative chromatography is a form of purification.
Analytical
chromatography measures the relative proportions of components in a
mixture and may be used to chracterize specific components by
comparison with standards or to characterize the mixture. There
are many types of preparative and analytical
chromatography, including thin layer chromatography (TLC), column
chromatography (CC), gas chromatography (GC) and high pressure liquid
chromatography (HPLC).
All chromatographic techniques, whether preparative or analytical, involve a two component system: 1) a stationary phase and 2) a mobile phase. In TLC, the stationary phase is a plastic, glass or aluminum plate (usually 2.5cm X 10cm) coated with a material that serves as the stationary phase. The term stationary phase is used to describe the material on the plate becasue it does not move during the analysis, or it remains "stationary". Silica gel is most commonly used as a stationary phase for simple TLC analysis, but numerous other stationary phases can be employed for more sophisticated experiments. The mobile phase is a solvent that moves during the analysis and carries the analyte(s) (compound or compounds of the mixture) along the stationary phase. The mobile phase of a TLC analysis is also called the developing solvent. The developing solvent may be a single organic solvent or a mixture of two or more organic solvents. When binary (two solvents) or tertiary (three solvents) mixtures are used, they must be completely miscible in each other. Usually the solvents are of different polarities. Aqueous solvents are rarely used for simple TLC analyses. For CC, the stationary phase is the column packing material (often silica gel or alumina) and the mobile phase is the solvent that runs through the column carrying the analytes. For both TLC and CC, different components of the mixture will adhere to the stationary phase to different degrees depending on the relative polarity between the stationary phase and the specific component of the mixture. Polar components adhere strongly to a polar stationary phase; non-polar components adhere weakly to a polar stationary phase. For example, silica gel, the stationary phase used in this experiment is very polar. Very polar components of the mixture will adhere strongly to the silica gel, while less polar constituents have a weaker attraction. When the plate in a TLC analysis is developed, the polar components will tend to stay at the bottom of the plate (bound to the silica gel) and the non-polar components will tend to move with the relatively less polar mobile phase (developing solvent). The polar components will have a smaller Rf value than less polar components. For CC, the more polar component will remain at the origin (or top of the column) and the less polar components will move down the column at a faster rate. Thus polar components have longer retention times (rt) and non-polar components have shorter retention times. Non-polar stationary phases are hydrocarbon-based and are usually desginated by the number of carbons associated with the packing material. Non-polar columns (CC) and plates (TLC) are often referred to as C18 or C22 to indicate ther number of carbons in the hydrocarbon making up the non-polar stationary phase. |
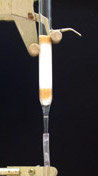  Preparative Column
Chromatography
|
|
|
|
|
|
|
|
|
|
|
|
|
Solvent Combinations for Use as Mobile Phase in TLC Analysis
Determining an appropriate mobile phase to achieve maximal separation of components in a mixture is a trial and error process. Ideally, all components of the mixture should be cleanly resolved (separated) from each other with no overlapping. All the components should also be located in the bottom/middle two thirds of a TLC plate after it has been developed. The only way to find a mobile phase that will result in meeting these criteria is to try a solvent mixture of a specific ratio and see what happens. If the desired results are not achieved, then adjust the solvent ratios. Consider some simple scenarios for guidance in how to adjust the ratios of solvent of binary or tertiary mobile phases to get the results you want.

Figure 2.5: Developed in 50:50 |

Figure 2.6: Developed in 75:25 |
 Figure 2.7: Developed in 90:10 |
Figure 2.8: Developed in 50:50 |
 Figure 2.9: Developed in 75:25 Ethyl acetate-hexane |
 Figure 2.10: Developed in 90:10 Ethyl acetate-hexane |
|
distance traveled by the solvent front |
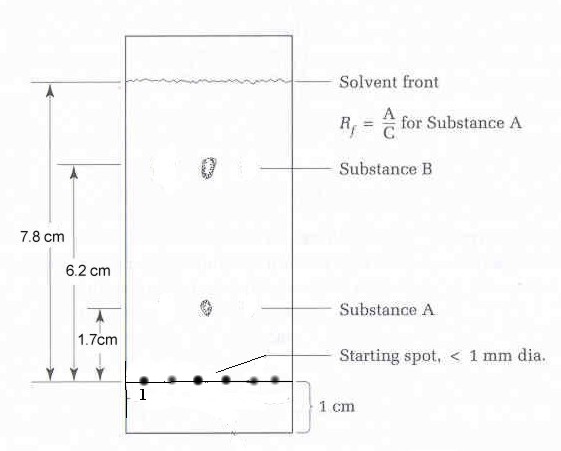 Figure 2.11: Calculating retention factors (adapted from Feiser & Williamson, p. 126) |
|
|
|
|
| 2850-2960 cm-1 |
|
medium-strong |
| 3020-3100 cm-1 |
|
medium-strong |
| 1640-1680 cm-1 |
|
medium |
| 3300 cm-1 |
|
strong |
| 2100-2260 cm-1 |
CºC of nitriles |
weak-medium |
| 500-800 cm-1 |
|
strong |
| 3200-3650 cm-1 |
|
strong, broad |
| 1660-2000 cm-1 1450-1600 cm-1 |
|
weak medium |
| 1680-1850 cm-1 |
ketones, aldehydes, esters, carboxylic acids, amides See more specific ranges |
strong |
| 3300-3500 cm-1 1030-1230 cm-1 |
C-N of amines |
medium medium |
| 1540 cm-1 |
|
strong |
Characterisic IR Absorbances Ranges for
Various
Bond Types
Interpretation
of the IR Spectrum
Interpretation of IR
spectra
involves correlating peaks in an
experimentally
generated spectrum with known ranges for specific bond or functional
group
types present in the structure of the compound that is being
analyzed.. There are some general guidelines that
can
be used to interpret an IR spectrum.
|
|
|
|
|
|
|
|
Sample Preparation and the
Infrared Spectrophotometer
There
are a variety of methods for preparing samples for IR
analysis.
The most common methods of sample prepartion for IR analysis are listed
in the table below.
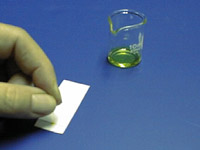
Liquid samples will typically be run in this course using sodium
chloride
plates (i.e. salt plates). The sample is prepared by placing a
few
drops of the liquid compound on one salt plate and placing a second
salt
plate on top of the first. Solid samples will be prepared for IR
analysis using potassium bromide pellets. Pellets are prepared by
mixing the solid sample with KBr, placing the mixture in a mini-press
and
compressing the mixture for form a small disc or pellets. ATR
analysis is a faster and simpler way to run solid samples. Other
sample
preparation methods (mull, solution) are available but will not be used
in this
course.
A mull is prepared by grinding
a solid sample with mineral oil to form a paste which is then placed
between
salt plates for analysis. The solutions of samples, either
liquids
or solids can analyzed using special solution cells.
|
|
|
|
|
|
|
|
|
|
|
|
|
|
|
Sample Preparation Methods for IR Spectroscopy
|
Enantiomers Chiral or assymmetric
molecules arise due to the presence of an sp3
carbon that is directly bonded to four unique substitutents. The
four
substituents may be four different atoms or they may be the same atom,
each with different hybridization or secondary substituents.
Molecules that contain chiral carbon atoms give rise to
stereoisomers.
If the molecule contains only one chiral carbon atom, two
stereoisomers, called enantiomers, are
possible. Each
enantiomer is a unique molecule, however the enantiomeric pair differs
only by the specific spacial arrangement of the four substituents
around the chiral carbon atom. R- and S- carvone are examples of an
enantiomeric pair. Enantiomers are often defined as non-superimposable, mirror image
isomers. Enantiomers
have exactly the same physical properties (boiling point, melting
point, density, Rf values, retention times etc) except, thay have optical rotations that
are equal in magnitude but opposite (+ or -)
in the direction that each isomer rotates a plane of polarized light. A
racemic mixture
is defined as a 50:50 mixture of an enatiomeric pair. Many drugs that
contain chiral carbon atoms are sold as racemic mixtures since
separation of the two compounds is very expensive. However,
enantiomers
often do not have the same biological and toxicological activity.
For
this reason, the Food and Drug Administration (FDA) requires
pharmaceutical companies to separate and test each enantiomer for its
specific biological activity and toxicity before recieving approval for
sale in the United States.
|
Samples
for polarimetry are typically dissolved in a solvent (eg. CHCl3,
hexane). Appropriate solvents are not optically active and
completely
dissolve the compound to be analyzed. To ensure consistency in
measurement, optical rotation of a sample is reported as specific
rotation  to correct for variability in
sample tube length,
temperature,
solvent wavelength of the light source and concentration of the
sample. The specific rotation of a sample is given by the
equation on the right. Liquid samples may also be run "neat
(i.e., no solvent). In these cases, the concentration term, c,
is replaced with the density of the liquid. Pure enantiomers will
give rise to a specific rotation that is consistent with a literature
value for that enantiomer. The specific rotation of a racemic
mixture will be zero, since the magnitude and direction of a specific
enantiomer will be "cancelled out" by the other enantiomer of the pair. to correct for variability in
sample tube length,
temperature,
solvent wavelength of the light source and concentration of the
sample. The specific rotation of a sample is given by the
equation on the right. Liquid samples may also be run "neat
(i.e., no solvent). In these cases, the concentration term, c,
is replaced with the density of the liquid. Pure enantiomers will
give rise to a specific rotation that is consistent with a literature
value for that enantiomer. The specific rotation of a racemic
mixture will be zero, since the magnitude and direction of a specific
enantiomer will be "cancelled out" by the other enantiomer of the pair. |
 |