
Organic Chemistry Laboratory I
Spectroscopy
Experiment:
Infrared, Nuclear Magnetic Resonance
and Mass
Spectroscopy
Experiment Description and Background
Organic Chemistry Laboratory I
Spectroscopy
Experiment:
Infrared, Nuclear Magnetic Resonance
and Mass
Spectroscopy
Experiment Description and Background
|
|
(Hertz (Hz)) |
(meters (m)) |
Structural Information |
|
|
(infrared region) |
|
|
|
|
(radio wave region) |
|
|
|
|
2.5 X 10¹⁶
-
2 X 10¹⁵
|
1 X 10⁻⁸ - 3.8 X 10⁻⁷ | Pi and Conjugated System |
| Mass
Spectroscopy |
--- |
--- |
Molecular
Mass Isotopes of Cl, Br |
Table 1: Structual Information of Organic
Compounds
obtained from Different types of Spectroscopy
|
|
|
|
| 2850-2960 cm-1 |
|
medium-strong |
| 3020-3100 cm-1 |
|
medium-strong |
| 1640-1680 cm-1 |
|
medium |
| 3300 cm-1 |
|
strong |
| 2100-2260 cm-1 |
CºC of nitriles |
weak-medium |
| 500-800 cm-1 |
|
strong |
| 3200-3650 cm-1 |
|
strong, broad |
| 1660-2000 cm-1 1450-1600 cm-1 |
|
weak medium |
| 1680-1850 cm-1 |
ketones, aldehydes, esters, carboxylic acids, amides See more specific ranges |
strong |
| 3300-3500 cm-1 1030-1230 cm-1 |
C-N of amines |
medium medium |
| 1540 cm-1 |
|
strong |
|
|
|
|
|
|
|
|
|
|
|
|
|
|
|
| Solvent |
Molecular
Formula |
| carbon tetrachloride |
CCl4 |
| deuterated chloroform |
CDCl3 |
| deuterated acetone |
C3D6O |
| deuterated
dimethylsulfoxide
(DMSO) |
C2D6SO |
| deuterated methanol |
CD3OD |
 Figure
1: Proton NMR Spectrum of Ethyl
Acetate
|
The
proton NMR spectrum of ethyl acetate is
given in Figure 3 There
are three distinct peaks or resonances
in the spectrum. Two
of the peaks are
split or have multiplicities greater than
1. The
peak at 0 ppm corresponds to TMS, the
internal
standard and is not
"counted" as a peak.
The triplet at
1.1-1.35 ppm corresponds to the Hc
hydrogens of the CH3 group of
ethyl
acetate. This
peak is upfield of the
singlet with a chemical
shift of 2.0 ppm. The singlet corresponds
to the Ha hydrogens of the methyl
group of
ethyl acetate. Finally,
the quartet at
4.0-4.4 ppm, downfield of the singlet and
the triplet,
corresponds to the Hb hydrogens of the
other methyl group of ethyl
acetate.  Tetramethylsilane
(TMS)
or other “internal standards”
are used to calibrate the x-aixis of the
spectrum to set the scale for
thespectrum. TMS
is used most frequently
and always gives rise to a peak at zero.
The units of
x-axis of the
spectrum are parts per million (ppm) or
hertz (Hz). The ppm
units
are more commonly used and run from 1-10
ppm
or 1-12 ppm in a typical
proton spectrum. The
specific ppm unit
where a peak appears in
the spectrum is referred to as the
chemical shift of the proton(s) that
give
rise to that peak.
The
far left side of the
spectrum is referred to as downfield and the
far right side of
|
| Range |
Kind
of Proton |
| 0-1.5
ppm |
H atoms bonded to sp3 carbons where the sp3 carbons are only bonded to other sp3 carbons and hydrogen (alkanes) |
| 1.5-2.5
ppm |
H atoms bonded to sp3 carbons where the sp3 carbon is bonded to at least one sp2 carbon and no heteroatoms (allylic, benzylic, alpha-H) |
| 2.5-4.5
ppm |
H atoms bonded to an sp3 carbon that is also bonded to at least one heteroatom |
| 4.5-6.5
ppm |
H atoms bonded to sp2 carbons of alkenes (not aromatic sp2 carbons) |
| 6.5-8.5
ppm |
H atoms bonded to sp2 carbons of an aromatic ring |
| 10-12
ppm |
H atom bonded to an sp2 carbon atom of the carbonyl group of an aldehyde or H atom bonded to the sp3 oxygen of a carboxylic acid. |
| Anywhere |
H
atom directly bonded to a heteroatom other
than the oxygen atom of a
carboxylic acid. Show
up as a broad
singlet (eg. OH of alcohol or phenol; NH
of amine or amide) |
|
|
There
are three different types
of protons (hydrogens) associated with
ethyl acetate, designated as Ha,
Hb and Hc in the structure at the
left. The designation of these
three types of atoms is determined based
on the fact that each of these
types of hydrogens are bonded to
different atoms in the structure of
ethyl acetate. The Ha hydrogens
are non-equivalent
with the Hb and Hc
hydrogens and it would be expected that
the NMR spectrum of ethyl
acetate would exhibit three distinct
peaks, each peak corresponding to
the three types of hydrogens in the
molecule. The three Ha
hydrogens are equivalent and
would be expected to appear as one peak
in the NMR spectrum.
Likewise, the three Hc protons are equivalent
and the two Hb protons are equivalent.
|
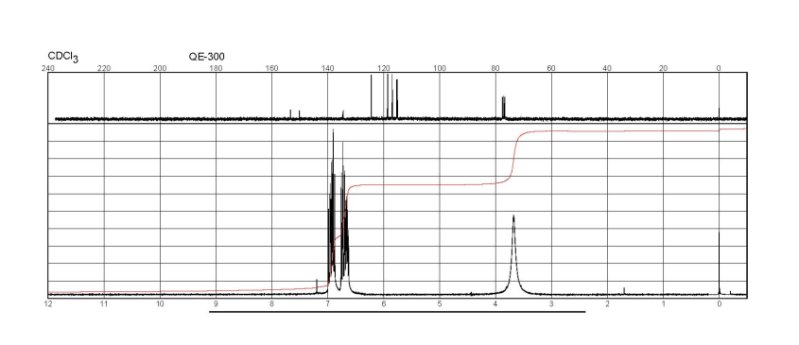
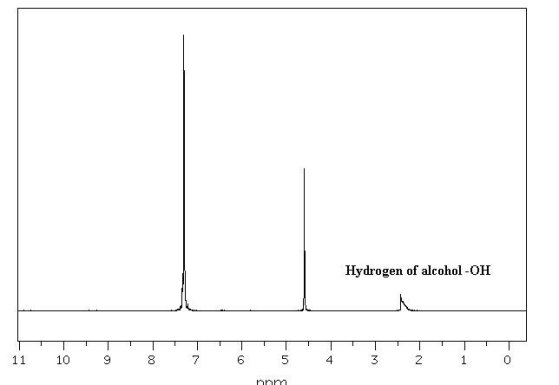 Figure
3: Proton NMR Spectrum of
an Alcohol
|
The proton NMR
spectrum of an alcohol in Figure 3 at
the left has three
"singlets", two sharp and one broad. The
two sharp singlets correspond to
equivalent aromatic protons (at ~7.4
ppm) and protons bonded to a heteroatom
(at ~ 4.7 ppm). The low,
broad “singlet
corresponds to the OH hydrogen of the
alcohol. Doublets appear
when there is one neighboring hydrogen
atom (n =1; m =1+1=2, doublet). A doublet is
present in the NMR spectrum of
isopropyl
alcohol (Figure 4, below right). The
doublet
corresponds to the six,
equivalent hydrogen atoms of the two
methyl groups labeled as Ha
protons in the
structure. The
Ha protons are split into
two parts by the one, neighboring
Hb proton. The Hb
proton appears as a multiplet (split
into seven parts parts) due to the six
neighboring Ha hydrogens. The Hc proton does not
appear in the spectrum. Protons
in a molecule that are
not near neighboring hydrogen atoms will
appear as singlets in the
proton NMR spectrum (n=0,
m=0 + 1= 1, singlet).
Hydrogen atoms
directly bonded to heteroatoms (OH, NH
etc) usually appear as singlets
as well,
however the shape of the peak for these
H atoms is usually low and
broad as
opposed to tall and sharp (with the
exception of carboxylic acid OH
hydrogens. These
are usually
sharp). Hydrogen
atoms
bonded to heteroatoms do not cause
splitting (even if they are
"neighboring") not do these hydrogen get
split. Sometimes,
protons
bonded to
heteroatoms do not appear in the
spectrum at all or are masked
underneath other peaks.
|
 Figure
4: Proton NMR Spectrum of
Isopropanol
|
 |
 Figure
5: Numerical Intergation
of Isopropanol
|
  Figure
6: Line Intergration of
2-Fluoroaniline
|
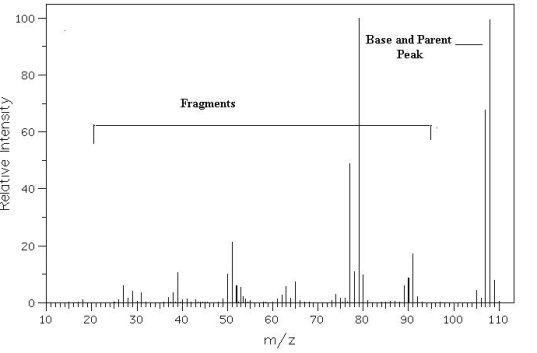 Figure
7: Sample Mass Spectrum
|
Appearance of the
Mass
Spectrum
Interpretation
of
Mass
SpectraThe mass spectrum is a graph (Figure 7). Along the x-axis is the mass/charge ratio, m/z. Along the y-axis is the relative abundance (RA), also called relative intensity (RI). Peaks appear as lines in the spectrum. Lines correspond to the molecular weight of the original molecule analyzed (M) or pieces (fragments) of the original molecule analyzed. The position of the line along the x-axis indicates the molecular weight of the molecule or fragment that corresponds to that line. The height of the peak corresponds to the amount of the molecule or fragment of an exact molecular weight that is present relative to other fragments of the molecule. The peak in the spectrum that corresponds to the original molecule, M, is called the parent peak or molecular ion. This peak is often, but not always the tallest peak in the spectrum. The parent peak is usually identified as the peak that is at at least 50% relative intensity and has the largest m/z value. The tallest peak in the spectrum is called the base peak. For molecules with a charge of +1 (typical for chemical ionization and electrom impact mass spectroscopy), the m/z value of the parent peak corresponds to the molecular weight of the molecule, M, if all atoms of the molecule are composed of the most abundant isotopes of the individual atoms that make up that molecule. Many atoms that are common in organic molecules have multiple isotopes, however usually only one isotope is highly naturally abundant. Table 6 lists the most important atoms in a mass spectral analysis of organic compounds. |
Table
6: Natural
abundances of Atoms
Common
to Organic Molecules.
|
|
For example, an organic
molecule
like methane, CH4, has a parent
peak
with a molecular weight of 16,
where the carbon atom of methane is 12C, the
most abundant
isotope of carbon. Carbon-12
has a
relative abundance of
98.895% and the height of the parent peak that contains
this isotope
will correspond to 98.89% relative intensity or
"relative abundance". There
will also be another small peak
in the spectrum at m/z =17 that corresponds to methane
where the carbon
atom is 13C, the carbon 13 isotope. This
peak will have a relative abundance of
1.1%. And finally there
will be a third
peak in the spectrum at 18, corresponding to methane
with 14C,
but
the relative abundance will be so small it may not be
detectable in the
spectrum. The peak at 16 is
called M+,
the peak at 17 is called M++1, and the peak
at 18 is called M++2. |
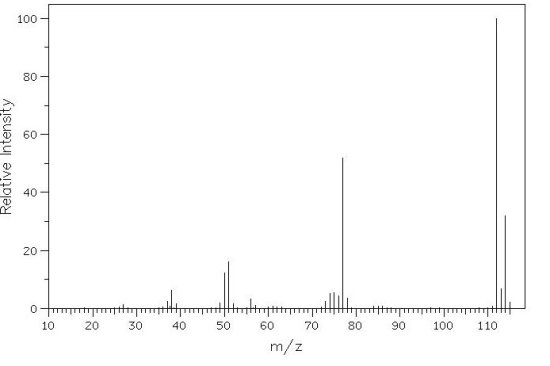 Figure
8: Mass Spectrum of Chlorobenzene
|
Table
7: Specific Molecular Formulas, with
isotopes for
chlorobenzene and the expected m/z values for observed
peaks
|